The simTool package: Facilitate simulations
Marsel Scheer
2026-02-01
Source:vignettes/simTool.Rmd
simTool.RmdA first example
- Generate data
- Fit different models
- Repeat step 1 and 2 three times
- Summarize the results with respect to the different data generating functions and models by calculating mean and standard deviation for the corresponding model terms
regData <- function(n, SD) {
  x <- seq(0, 1, length = n)
  y <- 10 + 2 * x + rnorm(n, sd = SD)
  tibble(x = x, y = y)
}

eval_tibbles(
  expand_tibble(fun = "regData", n = 5L, SD = 1:2),
  expand_tibble(proc = "lm", formula = c("y~x", "y~I(x^2)")),
  post_analyze = broom::tidy,
  summary_fun = list(mean = mean, sd = sd),
  group_for_summary = "term",
  replications = 3
)
[38;5;246m# A tibble: 16 × 12
[39m
   fun         n    SD replications summary_fun proc  formula  term     estimate std.error statistic

[3m
[38;5;246m<chr>
[39m
[23m
[3m
[38;5;246m<int>
[39m
[23m
[3m
[38;5;246m<int>
[39m
[23m
[3m
[38;5;246m<int>
[39m
[23m
[3m
[38;5;246m<chr>
[39m
[23m
[3m
[38;5;246m<chr>
[39m
[23m
[3m
[38;5;246m<chr>
[39m
[23m
[3m
[38;5;246m<chr>
[39m
[23m
[3m
[38;5;246m<dbl>
[39m
[23m
[3m
[38;5;246m<dbl>
[39m
[23m
[3m
[38;5;246m<dbl>
[39m
[23m

[38;5;250m 1
[39m regData     5     1            1 mean        lm    y~x      (Interc…   10.1      0.692     16.5

[38;5;250m 2
[39m regData     5     1            1 mean        lm    y~x      x           2.92     1.13       3.59

[38;5;250m 3
[39m regData     5     1            1 mean        lm    y~I(x^2) (Interc…   10.5      0.544     20.2

[38;5;250m 4
[39m regData     5     1            1 mean        lm    y~I(x^2) I(x^2)      2.71     1.04       3.20

[38;5;250m 5
[39m regData     5     1            1 sd          lm    y~x      (Interc…    1.45     0.288      6.89

[38;5;250m 6
[39m regData     5     1            1 sd          lm    y~x      x           1.84     0.471      3.71

[38;5;250m 7
[39m regData     5     1            1 sd          lm    y~I(x^2) (Interc…    1.32     0.185      4.38

[38;5;250m 8
[39m regData     5     1            1 sd          lm    y~I(x^2) I(x^2)      2.15     0.352      2.62

[38;5;250m 9
[39m regData     5     2            1 mean        lm    y~x      (Interc…    9.86     1.26       7.85

[38;5;250m10
[39m regData     5     2            1 mean        lm    y~x      x           3.42     2.05       1.66

[38;5;250m11
[39m regData     5     2            1 mean        lm    y~I(x^2) (Interc…   10.6      1.18       8.99

[38;5;250m12
[39m regData     5     2            1 mean        lm    y~I(x^2) I(x^2)      2.65     2.24       1.17

[38;5;250m13
[39m regData     5     2            1 sd          lm    y~x      (Interc…    0.209    0.037
[4m4
[24m     0.393

[38;5;250m14
[39m regData     5     2            1 sd          lm    y~x      x           1.17     0.061
[4m0
[24m     0.515

[38;5;250m15
[39m regData     5     2            1 sd          lm    y~I(x^2) (Interc…    0.128    0.048
[4m8
[24m     0.436

[38;5;250m16
[39m regData     5     2            1 sd          lm    y~I(x^2) I(x^2)      1.32     0.092
[4m7
[24m     0.542

[38;5;246m# ℹ 1 more variable: p.value <dbl>
[39m
Number of data generating functions: 2
Number of analyzing procedures: 2
Number of replications: 3
Estimated replications per hour: 122175
Start of the simulation: 2026-02-01 14:30:12.845667
End of the simulation: 2026-02-01 14:30:12.934064
Introduction
The purpose of the simTool package is to disengage the research from any kind of administrative source code which is usually an annoying necessity of a simulation study.
This vignette will give an introduction into the simTool package mainly by examples of growing complexity. The workhorse is the function eval_tibbles. Every parameter of this function will be discussed briefly and the functionality is illustrated by at least one example.
Workflow
The workflow is quite easy and natural. One defines two data.frames (or tibbles), the first one represents the functions that generate the data sets and the second one represents the functions that analyze the data. These two data.frames are passed to eval_tibbles which conducts the simulation. Afterwards, the results can nicely be displayed as a data.frame.
Defining the data.frames for data generation and analysis
There are 3 rules:
- the first column ( a character vector) defines the functions to be called
- the other columns are the parameters that are passed to function specified in the first column
- The entry NA will not be passed to the function specified in the first column.
The function expand_tibble is a convenient function for defining such data.frames.
We now define the data generation functions for our first simulation.
print(dg <- dplyr::bind_rows(
  expand_tibble(fun = "rexp", n = c(10L, 20L), rate = 1:2),
  expand_tibble(fun = "rnorm", n = c(10L, 20L), mean = 1:2)
))
[38;5;246m# A tibble: 8 × 4
[39m
  fun       n  rate  mean

[3m
[38;5;246m<chr>
[39m
[23m
[3m
[38;5;246m<int>
[39m
[23m
[3m
[38;5;246m<int>
[39m
[23m
[3m
[38;5;246m<int>
[39m
[23m

[38;5;250m1
[39m rexp     10     1
[31mNA
[39m

[38;5;250m2
[39m rexp     20     1
[31mNA
[39m

[38;5;250m3
[39m rexp     10     2
[31mNA
[39m

[38;5;250m4
[39m rexp     20     2
[31mNA
[39m

[38;5;250m5
[39m rnorm    10
[31mNA
[39m     1

[38;5;250m6
[39m rnorm    20
[31mNA
[39m     1

[38;5;250m7
[39m rnorm    10
[31mNA
[39m     2

[38;5;250m8
[39m rnorm    20
[31mNA
[39m     2
This data.frame represents 8 R-functions. For instance, the second row represents a function that generates 20 exponential distributed random variables with rate 1. Since mean=NA in the second row, this parameter is not passed to rexp.
Similar, we define the data.frame for data analyzing functions.
print(pg <- dplyr::bind_rows(
  expand_tibble(proc = "min"),
  expand_tibble(proc = "mean", trim = c(0.1, 0.2))
))
[38;5;246m# A tibble: 3 × 2
[39m
  proc   trim

[3m
[38;5;246m<chr>
[39m
[23m
[3m
[38;5;246m<dbl>
[39m
[23m

[38;5;250m1
[39m min
[31mNA
[39m

[38;5;250m2
[39m mean    0.1

[38;5;250m3
[39m mean    0.2
Hence, this data.frame represents 3 R-functions i.e. calculating the minimum and the arithmetic mean with trim=0.1 and trim=0.2.
The workhorse eval_tibbles
The workhorse eval_tibbles has the following simplified pseudo code:
1.  convert dg to R-functions  {g_1, ..., g_k}
2.  convert pg to R-functions  {f_1, ..., f_L}
3.  initialize result object
4.  append dg and pg to the result object
5.  t1 = current.time()
6.  for g in  {g_1, ..., g_k}
7.      for r in 1:replications (optionally in a parallel manner)
8.          data = g()
9.          for f in  {f_1, \ldots, f_L}
10.             append f(data) to the result object (optionally apply a post-analyze-function)
11.         optionally append data to the result object
12.      optionally summarize the result object over all
         replications but separately for f_1, ..., f_L (and optional group variables)
13. t2 = current.time()
14. Estimate the number of replications per hour from t1 and t2
The object returned by eval_tibbles is a list of class eval_tibbles.
dg <- expand_tibble(fun = "rnorm", n = 10, mean = 1:2)
pg <- expand_tibble(proc = "min")
eg <- eval_tibbles(data_grid = dg, proc_grid = pg, replications = 2)
eg
[38;5;246m# A tibble: 4 × 6
[39m
  fun       n  mean replications proc  results

[3m
[38;5;246m<chr>
[39m
[23m
[3m
[38;5;246m<dbl>
[39m
[23m
[3m
[38;5;246m<int>
[39m
[23m
[3m
[38;5;246m<int>
[39m
[23m
[3m
[38;5;246m<chr>
[39m
[23m
[3m
[38;5;246m<dbl>
[39m
[23m

[38;5;250m1
[39m rnorm    10     1            1 min    -
[31m1
[39m
[31m.
[39m
[31m75
[39m

[38;5;250m2
[39m rnorm    10     1            2 min    -
[31m0
[39m
[31m.
[39m
[31m212
[39m

[38;5;250m3
[39m rnorm    10     2            1 min     0.232

[38;5;250m4
[39m rnorm    10     2            2 min     1.16
Number of data generating functions: 2
Number of analyzing procedures: 1
Number of replications: 2
Estimated replications per hour: 83886080
Start of the simulation: 2026-02-01 14:30:13.277104
End of the simulation: 2026-02-01 14:30:13.27719
As you can see, the function always estimates the number of replications that can be done in one hour.
Parameter replications
Of course, this parameter controls the number of replications conducted.
eg <- eval_tibbles(data_grid = dg, proc_grid = pg, replications = 3)
eg
[38;5;246m# A tibble: 6 × 6
[39m
  fun       n  mean replications proc  results

[3m
[38;5;246m<chr>
[39m
[23m
[3m
[38;5;246m<dbl>
[39m
[23m
[3m
[38;5;246m<int>
[39m
[23m
[3m
[38;5;246m<int>
[39m
[23m
[3m
[38;5;246m<chr>
[39m
[23m
[3m
[38;5;246m<dbl>
[39m
[23m

[38;5;250m1
[39m rnorm    10     1            1 min    -
[31m1
[39m
[31m.
[39m
[31m30
[39m

[38;5;250m2
[39m rnorm    10     1            2 min    -
[31m0
[39m
[31m.
[39m
[31m574
[39m

[38;5;250m3
[39m rnorm    10     1            3 min     0.503

[38;5;250m4
[39m rnorm    10     2            1 min     0.729

[38;5;250m5
[39m rnorm    10     2            2 min     1.06

[38;5;250m6
[39m rnorm    10     2            3 min    -
[31m0
[39m
[31m.
[39m
[31m272
[39m
Number of data generating functions: 2
Number of analyzing procedures: 1
Number of replications: 3
Estimated replications per hour: 98689505
Start of the simulation: 2026-02-01 14:30:13.367208
End of the simulation: 2026-02-01 14:30:13.367318
Parameter discard_generated_data
eval_tibbles saves ALL generated data sets.
eg <- eval_tibbles(data_grid = dg, proc_grid = pg, replications = 1)
eg$simulation
[38;5;246m# A tibble: 2 × 6
[39m
  fun       n  mean replications proc   results

[3m
[38;5;246m<chr>
[39m
[23m
[3m
[38;5;246m<dbl>
[39m
[23m
[3m
[38;5;246m<int>
[39m
[23m
[3m
[38;5;246m<int>
[39m
[23m
[3m
[38;5;246m<chr>
[39m
[23m
[3m
[38;5;246m<dbl>
[39m
[23m

[38;5;250m1
[39m rnorm    10     1            1 min   -
[31m0
[39m
[31m.
[39m
[31m554
[39m

[38;5;250m2
[39m rnorm    10     2            1 min    0.004
[4m9
[24m
[4m9
[24m
eg$generated_data[[1]]
[1] 1.04382239 -0.02157836 1.79342772 1.50162446 -0.55447035 1.88349784 0.79223220 2.83137401
[9] 1.17726438 0.19415935
[[2]]
[1] 3.947932470 2.121197052 1.645050873 3.052866250 3.163113962 1.201167182 2.775455294 0.004992648
[9] 1.649437807 2.380864742In general, it is sometimes very handy to have the data sets in order to investigate unusual or unexpected results. But saving the generated data sets can be very memory consuming. Stop saving the generated data sets can be obtained by setting discardGeneratedData = TRUE. See command line 11 in the pseudo code.
Parameter summary_fun
As stated in command line 12 we can summarize the result objects over all replications but separately for all data analyzing functions.
dg <- expand_tibble(fun = "runif", n = c(10, 20, 30))
pg <- expand_tibble(proc = c("min", "max"))
eval_tibbles(
  data_grid = dg, proc_grid = pg, replications = 1000,
  summary_fun = list(mean = mean)
)
[38;5;246m# A tibble: 6 × 6
[39m
  fun       n replications summary_fun proc   value

[3m
[38;5;246m<chr>
[39m
[23m
[3m
[38;5;246m<dbl>
[39m
[23m
[3m
[38;5;246m<int>
[39m
[23m
[3m
[38;5;246m<chr>
[39m
[23m
[3m
[38;5;246m<chr>
[39m
[23m
[3m
[38;5;246m<dbl>
[39m
[23m

[38;5;250m1
[39m runif    10            1 mean        min   0.090
[4m4
[24m

[38;5;250m2
[39m runif    10            1 mean        max   0.910

[38;5;250m3
[39m runif    20            1 mean        min   0.048
[4m6
[24m

[38;5;250m4
[39m runif    20            1 mean        max   0.953

[38;5;250m5
[39m runif    30            1 mean        min   0.031
[4m4
[24m

[38;5;250m6
[39m runif    30            1 mean        max   0.967
Number of data generating functions: 3
Number of analyzing procedures: 2
Number of replications: 1000
Estimated replications per hour: 52156427
Start of the simulation: 2026-02-01 14:30:13.550125
End of the simulation: 2026-02-01 14:30:13.619148
eval_tibbles(
  data_grid = dg, proc_grid = pg, replications = 1000,
  summary_fun = list(mean = mean, sd = sd)
)
[38;5;246m# A tibble: 12 × 6
[39m
   fun       n replications summary_fun proc   value

[3m
[38;5;246m<chr>
[39m
[23m
[3m
[38;5;246m<dbl>
[39m
[23m
[3m
[38;5;246m<int>
[39m
[23m
[3m
[38;5;246m<chr>
[39m
[23m
[3m
[38;5;246m<chr>
[39m
[23m
[3m
[38;5;246m<dbl>
[39m
[23m

[38;5;250m 1
[39m runif    10            1 mean        min   0.093
[4m0
[24m

[38;5;250m 2
[39m runif    10            1 mean        max   0.907

[38;5;250m 3
[39m runif    10            1 sd          min   0.086
[4m5
[24m

[38;5;250m 4
[39m runif    10            1 sd          max   0.086
[4m0
[24m

[38;5;250m 5
[39m runif    20            1 mean        min   0.046
[4m3
[24m

[38;5;250m 6
[39m runif    20            1 mean        max   0.952

[38;5;250m 7
[39m runif    20            1 sd          min   0.042
[4m5
[24m

[38;5;250m 8
[39m runif    20            1 sd          max   0.046
[4m8
[24m

[38;5;250m 9
[39m runif    30            1 mean        min   0.032
[4m5
[24m

[38;5;250m10
[39m runif    30            1 mean        max   0.966

[38;5;250m11
[39m runif    30            1 sd          min   0.032
[4m3
[24m

[38;5;250m12
[39m runif    30            1 sd          max   0.031
[4m1
[24m
Number of data generating functions: 3
Number of analyzing procedures: 2
Number of replications: 1000
Estimated replications per hour: 47464327
Start of the simulation: 2026-02-01 14:30:13.646593
End of the simulation: 2026-02-01 14:30:13.72244
Note, by specifying the parameter summary_fun the generated data sets and all individual result objects are discarded. In this example we discard data sets and individual result objects.
Parameter post_analyze
Sometimes the analyzing functions return quite complicated objects like in the Section A first example.
eval_tibbles(
  expand_tibble(fun = "regData", n = 5L, SD = 1:2),
  expand_tibble(proc = "lm", formula = c("y~x", "y~I(x^2)")),
  replications = 2
)
[38;5;246m# A tibble: 8 × 7
[39m
  fun         n    SD replications proc  formula  results

[3m
[38;5;246m<chr>
[39m
[23m
[3m
[38;5;246m<int>
[39m
[23m
[3m
[38;5;246m<int>
[39m
[23m
[3m
[38;5;246m<int>
[39m
[23m
[3m
[38;5;246m<chr>
[39m
[23m
[3m
[38;5;246m<chr>
[39m
[23m
[3m
[38;5;246m<list>
[39m
[23m

[38;5;250m1
[39m regData     5     1            1 lm    y~x
[38;5;246m<lm>
[39m

[38;5;250m2
[39m regData     5     1            1 lm    y~I(x^2)
[38;5;246m<lm>
[39m

[38;5;250m3
[39m regData     5     1            2 lm    y~x
[38;5;246m<lm>
[39m

[38;5;250m4
[39m regData     5     1            2 lm    y~I(x^2)
[38;5;246m<lm>
[39m

[38;5;250m5
[39m regData     5     2            1 lm    y~x
[38;5;246m<lm>
[39m

[38;5;250m6
[39m regData     5     2            1 lm    y~I(x^2)
[38;5;246m<lm>
[39m

[38;5;250m7
[39m regData     5     2            2 lm    y~x
[38;5;246m<lm>
[39m

[38;5;250m8
[39m regData     5     2            2 lm    y~I(x^2)
[38;5;246m<lm>
[39m
Number of data generating functions: 2
Number of analyzing procedures: 2
Number of replications: 2
Estimated replications per hour: 1062633
Start of the simulation: 2026-02-01 14:30:13.81296
End of the simulation: 2026-02-01 14:30:13.819736
The parameter post_analyze (if specified) is applied directly after the result was generated (see command line 10). Note, purrr::compose can be very handy if your post-analyzing-function can be defined by a few single functions:
eval_tibbles(
  expand_tibble(fun = "regData", n = 5L, SD = 1:2),
  expand_tibble(proc = "lm", formula = c("y~x", "y~I(x^2)")),
  post_analyze = purrr::compose(function(mat) mat["(Intercept)", "Estimate"], coef, summary.lm),
  replications = 2
)
[38;5;246m# A tibble: 8 × 7
[39m
  fun         n    SD replications proc  formula  results

[3m
[38;5;246m<chr>
[39m
[23m
[3m
[38;5;246m<int>
[39m
[23m
[3m
[38;5;246m<int>
[39m
[23m
[3m
[38;5;246m<int>
[39m
[23m
[3m
[38;5;246m<chr>
[39m
[23m
[3m
[38;5;246m<chr>
[39m
[23m
[3m
[38;5;246m<dbl>
[39m
[23m

[38;5;250m1
[39m regData     5     1            1 lm    y~x        10.3

[38;5;250m2
[39m regData     5     1            1 lm    y~I(x^2)   10.2

[38;5;250m3
[39m regData     5     1            2 lm    y~x         9.43

[38;5;250m4
[39m regData     5     1            2 lm    y~I(x^2)    9.95

[38;5;250m5
[39m regData     5     2            1 lm    y~x        13.5

[38;5;250m6
[39m regData     5     2            1 lm    y~I(x^2)   13.3

[38;5;250m7
[39m regData     5     2            2 lm    y~x         9.27

[38;5;250m8
[39m regData     5     2            2 lm    y~I(x^2)    9.25
Number of data generating functions: 2
Number of analyzing procedures: 2
Number of replications: 2
Estimated replications per hour: 540097
Start of the simulation: 2026-02-01 14:30:13.987709
End of the simulation: 2026-02-01 14:30:14.00104
Parameter group_for_summary
When the result object is a data.frame itself, for instance
presever_rownames <- function(mat) {
  rn <- rownames(mat)
  ret <- tibble::as_tibble(mat)
  ret$term <- rn
  ret
}

eval_tibbles(
  expand_tibble(fun = "regData", n = 5L, SD = 1:2),
  expand_tibble(proc = "lm", formula = c("y~x", "y~I(x^2)")),
  post_analyze = purrr::compose(presever_rownames, coef, summary),
  replications = 3
)
[38;5;246m# A tibble: 24 × 11
[39m
   fun         n    SD replications proc  formula  Estimate `Std. Error` `t value` `Pr(>|t|)` term

[3m
[38;5;246m<chr>
[39m
[23m
[3m
[38;5;246m<int>
[39m
[23m
[3m
[38;5;246m<int>
[39m
[23m
[3m
[38;5;246m<int>
[39m
[23m
[3m
[38;5;246m<chr>
[39m
[23m
[3m
[38;5;246m<chr>
[39m
[23m
[3m
[38;5;246m<dbl>
[39m
[23m
[3m
[38;5;246m<dbl>
[39m
[23m
[3m
[38;5;246m<dbl>
[39m
[23m
[3m
[38;5;246m<dbl>
[39m
[23m
[3m
[38;5;246m<chr>
[39m
[23m

[38;5;250m 1
[39m regData     5     1            1 lm    y~x          9.91        0.670    14.8     0.000
[4m6
[24m
[4m7
[24m
[4m1
[24m (Inte…

[38;5;250m 2
[39m regData     5     1            1 lm    y~x          2.80        1.09      2.56    0.083
[4m1
[24m   x

[38;5;250m 3
[39m regData     5     1            1 lm    y~I(x^2)    10.3         0.577    17.9     0.000
[4m3
[24m
[4m8
[24m
[4m1
[24m (Inte…

[38;5;250m 4
[39m regData     5     1            1 lm    y~I(x^2)     2.63        1.10      2.40    0.096
[4m1
[24m   I(x^2)

[38;5;250m 5
[39m regData     5     1            2 lm    y~x          9.32        0.537    17.3     0.000
[4m4
[24m
[4m1
[24m
[4m9
[24m (Inte…

[38;5;250m 6
[39m regData     5     1            2 lm    y~x          2.11        0.878     2.40    0.096
[4m0
[24m   x

[38;5;250m 7
[39m regData     5     1            2 lm    y~I(x^2)     9.78        0.590    16.6     0.000
[4m4
[24m
[4m7
[24m
[4m8
[24m (Inte…

[38;5;250m 8
[39m regData     5     1            2 lm    y~I(x^2)     1.56        1.12      1.39    0.259    I(x^2)

[38;5;250m 9
[39m regData     5     1            3 lm    y~x          9.64        1.16      8.28    0.003
[4m6
[24m
[4m9
[24m  (Inte…

[38;5;250m10
[39m regData     5     1            3 lm    y~x          1.83        1.90      0.965   0.406    x

[38;5;246m# ℹ 14 more rows
[39m
Number of data generating functions: 2
Number of analyzing procedures: 2
Number of replications: 3
Estimated replications per hour: 626257
Start of the simulation: 2026-02-01 14:30:14.097683
End of the simulation: 2026-02-01 14:30:14.114928
In order to summarize the replications it is necessary to additional group the calculations with respect to another variable. This variable can be passed to group_for_summary
eval_tibbles(
  expand_tibble(fun = "regData", n = 5L, SD = 1:2),
  expand_tibble(proc = "lm", formula = c("y~x", "y~I(x^2)")),
  post_analyze = purrr::compose(presever_rownames, coef, summary),
  summary_fun = list(mean = mean, sd = sd),
  group_for_summary = "term",
  replications = 3
)
[38;5;246m# A tibble: 16 × 12
[39m
   fun         n    SD replications summary_fun proc  formula  term  Estimate `Std. Error` `t value`

[3m
[38;5;246m<chr>
[39m
[23m
[3m
[38;5;246m<int>
[39m
[23m
[3m
[38;5;246m<int>
[39m
[23m
[3m
[38;5;246m<int>
[39m
[23m
[3m
[38;5;246m<chr>
[39m
[23m
[3m
[38;5;246m<chr>
[39m
[23m
[3m
[38;5;246m<chr>
[39m
[23m
[3m
[38;5;246m<chr>
[39m
[23m
[3m
[38;5;246m<dbl>
[39m
[23m
[3m
[38;5;246m<dbl>
[39m
[23m
[3m
[38;5;246m<dbl>
[39m
[23m

[38;5;250m 1
[39m regData     5     1            1 mean        lm    y~x      (Int…    9.95         0.500     53.5

[38;5;250m 2
[39m regData     5     1            1 mean        lm    y~x      x        2.04         0.817      6.86

[38;5;250m 3
[39m regData     5     1            1 mean        lm    y~I(x^2) (Int…   10.3          0.444     28.5

[38;5;250m 4
[39m regData     5     1            1 mean        lm    y~I(x^2) I(x^…    1.93         0.845      2.80

[38;5;250m 5
[39m regData     5     1            1 sd          lm    y~x      (Int…    0.505        0.404     66.9

[38;5;250m 6
[39m regData     5     1            1 sd          lm    y~x      x        0.382        0.660      8.87

[38;5;250m 7
[39m regData     5     1            1 sd          lm    y~I(x^2) (Int…    0.608        0.202     17.8

[38;5;250m 8
[39m regData     5     1            1 sd          lm    y~I(x^2) I(x^…    0.759        0.385      1.87

[38;5;250m 9
[39m regData     5     2            1 mean        lm    y~x      (Int…    9.38         0.787     13.6

[38;5;250m10
[39m regData     5     2            1 mean        lm    y~x      x        3.28         1.28       2.80

[38;5;250m11
[39m regData     5     2            1 mean        lm    y~I(x^2) (Int…    9.99         0.823     14.1

[38;5;250m12
[39m regData     5     2            1 mean        lm    y~I(x^2) I(x^…    2.74         1.57       1.79

[38;5;250m13
[39m regData     5     2            1 sd          lm    y~x      (Int…    1.06         0.271      7.18

[38;5;250m14
[39m regData     5     2            1 sd          lm    y~x      x        3.14         0.443      2.41

[38;5;250m15
[39m regData     5     2            1 sd          lm    y~I(x^2) (Int…    0.862        0.365      6.91

[38;5;250m16
[39m regData     5     2            1 sd          lm    y~I(x^2) I(x^…    2.74         0.694      1.73

[38;5;246m# ℹ 1 more variable: `Pr(>|t|)` <dbl>
[39m
Number of data generating functions: 2
Number of analyzing procedures: 2
Number of replications: 3
Estimated replications per hour: 210868
Start of the simulation: 2026-02-01 14:30:14.216754
End of the simulation: 2026-02-01 14:30:14.267971
Parameter ncpus and cluster_seed
By specifying ncpus larger than 1 a cluster objected is created for the user and passed to the parameter cluster discussed in the next section.
eval_tibbles(
  data_grid = dg, proc_grid = pg, replications = 10,
  ncpus = 2, summary_fun = list(mean = mean)
)
[38;5;246m# A tibble: 6 × 6
[39m
  fun       n replications summary_fun proc   value

[3m
[38;5;246m<chr>
[39m
[23m
[3m
[38;5;246m<dbl>
[39m
[23m
[3m
[38;5;246m<int>
[39m
[23m
[3m
[38;5;246m<chr>
[39m
[23m
[3m
[38;5;246m<chr>
[39m
[23m
[3m
[38;5;246m<dbl>
[39m
[23m

[38;5;250m1
[39m runif    10            1 mean        min   0.088
[4m4
[24m

[38;5;250m2
[39m runif    10            1 mean        max   0.912

[38;5;250m3
[39m runif    20            1 mean        min   0.065
[4m6
[24m

[38;5;250m4
[39m runif    20            1 mean        max   0.947

[38;5;250m5
[39m runif    30            1 mean        min   0.036
[4m2
[24m

[38;5;250m6
[39m runif    30            1 mean        max   0.969
Number of data generating functions: 3
Number of analyzing procedures: 2
Number of replications: 10
Estimated replications per hour: 96025
Start of the simulation: 2026-02-01 14:30:14.617123
End of the simulation: 2026-02-01 14:30:14.992023
As it is stated in command line 7, the replications are parallelized. In our case, this means that roughly every CPU conducts 5 replications.
The parameter cluster_seed must be an integer vector of length 6 and serves the same purpose as the function set.seed. By default, cluster_seed equals rep(12345, 6). Note, in order to reproduce the simulation study it is also necessary that ncpus does not change.
Parameter cluster
The user can create a cluster on its own. This also enables the user to distribute the replications over different computers in a network.
library(parallel)
cl <- makeCluster(rep("localhost", 2), type = "PSOCK")
eval_tibbles(
  data_grid = dg, proc_grid = pg, replications = 10,
  cluster = cl, summary_fun = list(mean = mean)
)
[38;5;246m# A tibble: 6 × 6
[39m
  fun       n replications summary_fun proc   value

[3m
[38;5;246m<chr>
[39m
[23m
[3m
[38;5;246m<dbl>
[39m
[23m
[3m
[38;5;246m<int>
[39m
[23m
[3m
[38;5;246m<chr>
[39m
[23m
[3m
[38;5;246m<chr>
[39m
[23m
[3m
[38;5;246m<dbl>
[39m
[23m

[38;5;250m1
[39m runif    10            1 mean        min   0.088
[4m4
[24m

[38;5;250m2
[39m runif    10            1 mean        max   0.912

[38;5;250m3
[39m runif    20            1 mean        min   0.065
[4m6
[24m

[38;5;250m4
[39m runif    20            1 mean        max   0.947

[38;5;250m5
[39m runif    30            1 mean        min   0.036
[4m2
[24m

[38;5;250m6
[39m runif    30            1 mean        max   0.969
Number of data generating functions: 3
Number of analyzing procedures: 2
Number of replications: 10
Estimated replications per hour: 96961
Start of the simulation: 2026-02-01 14:30:15.350815
End of the simulation: 2026-02-01 14:30:15.722096
stopCluster(cl)As you can see our cluster consists of 3 workers. Hence, this reproduces the results from the last code chunk above. Further note, if the user starts the cluster, the user also has to stop the cluster. A cluster that is created within eval_tibbles by specifying ncpus is also stop within eval_tibbles.
Parameter cluster_libraries and cluster_global_objects
A newly created cluster is ``empty’’. Hence, if the simulation study requires libraries or objects from the global environment, they must be transferred to the cluster.
Lets look at standard example from the boot package.
library(boot)
ratio <- function(d, w) sum(d$x * w) / sum(d$u * w)
city.boot <- boot(city, ratio,
  R = 999, stype = "w",
  sim = "ordinary"
)
boot.ci(city.boot,
  conf = c(0.90, 0.95),
  type = c("norm", "basic", "perc", "bca")
)
BOOTSTRAP CONFIDENCE INTERVAL CALCULATIONS
Based on 999 bootstrap replicates
CALL :
boot.ci(boot.out = city.boot, conf = c(0.9, 0.95), type = c("norm",
"basic", "perc", "bca"))
Intervals :
Level Normal Basic
90% ( 1.098, 1.861 ) ( 1.047, 1.772 )
95% ( 1.026, 1.934 ) ( 0.860, 1.799 )
Level Percentile BCa
90% ( 1.268, 1.994 ) ( 1.271, 2.002 )
95% ( 1.241, 2.180 ) ( 1.242, 2.195 )
Calculations and Intervals on Original ScaleThe following data generating function is extremely boring because it always returns the data set city from the library boot.
returnCity <- function() {
  city
}
bootConfInt <- function(data) {
  city.boot <- boot(data, ratio,
    R = 999, stype = "w",
    sim = "ordinary"
  )
  boot.ci(city.boot,
    conf = c(0.90, 0.95),
    type = c("norm", "basic", "perc", "bca")
  )
}
The function ratio exists at the moment only in our global environment. Further we had to load the boot package. Hence, we load the boot package by setting cluster_libraries = c(“boot”) and transfer the function ratio by setting cluster_global_objects = c(“ratio”).
dg <- expand_tibble(fun = "returnCity")
pg <- expand_tibble(proc = "bootConfInt")
eval_tibbles(dg, pg,
  replications = 10, ncpus = 2,
  cluster_libraries = c("boot"),
  cluster_global_objects = c("ratio")
)
[38;5;246m# A tibble: 10 × 4
[39m
   fun        replications proc        results

[3m
[38;5;246m<chr>
[39m
[23m
[3m
[38;5;246m<int>
[39m
[23m
[3m
[38;5;246m<chr>
[39m
[23m
[3m
[38;5;246m<list>
[39m
[23m

[38;5;250m 1
[39m returnCity            1 bootConfInt
[38;5;246m<bootci>
[39m

[38;5;250m 2
[39m returnCity            2 bootConfInt
[38;5;246m<bootci>
[39m

[38;5;250m 3
[39m returnCity            3 bootConfInt
[38;5;246m<bootci>
[39m

[38;5;250m 4
[39m returnCity            4 bootConfInt
[38;5;246m<bootci>
[39m

[38;5;250m 5
[39m returnCity            5 bootConfInt
[38;5;246m<bootci>
[39m

[38;5;250m 6
[39m returnCity            6 bootConfInt
[38;5;246m<bootci>
[39m

[38;5;250m 7
[39m returnCity            7 bootConfInt
[38;5;246m<bootci>
[39m

[38;5;250m 8
[39m returnCity            8 bootConfInt
[38;5;246m<bootci>
[39m

[38;5;250m 9
[39m returnCity            9 bootConfInt
[38;5;246m<bootci>
[39m

[38;5;250m10
[39m returnCity           10 bootConfInt
[38;5;246m<bootci>
[39m
Number of data generating functions: 1
Number of analyzing procedures: 1
Number of replications: 10
Estimated replications per hour: 213533
Start of the simulation: 2026-02-01 14:30:16.533123
End of the simulation: 2026-02-01 14:30:16.701715
Of course, it is possible to set cluster_global_objects=ls(), but then all objects from the global environment are transferred to all workers.
Parameter envir
The function eval_tibbles generates in a first step function calls from data_grid and proc_grid. This is achieved by applying the R-function get. By default, envir=globalenv() and thus get searches the global environment of the current R session. An example shows how to use the parameter envir.
# masking summary from the base package
summary <- function(x) tibble(sd = sd(x))
g <- function(x) tibble(q0.1 = quantile(x, 0.1))
someFunc <- function() {
  summary <- function(x) tibble(sd = sd(x), mean = mean(x))

  dg <- expand_tibble(fun = "runif", n = 100)
  pg <- expand_tibble(proc = c("summary", "g"))

  # the standard is to use the global
  # environment, hence summary defined outside
  # of someFunc() will be used
  print(eval_tibbles(dg, pg))
  cat("--------------------------------------------------\n")
  # will use the local defined summary, but g
  # from the global environment, because
  # g is not locally defined.
  print(eval_tibbles(dg, pg, envir = environment()))
}
someFunc()
[38;5;246m# A tibble: 2 × 6
[39m
  fun       n replications proc        sd   q0.1

[3m
[38;5;246m<chr>
[39m
[23m
[3m
[38;5;246m<dbl>
[39m
[23m
[3m
[38;5;246m<int>
[39m
[23m
[3m
[38;5;246m<chr>
[39m
[23m
[3m
[38;5;246m<dbl>
[39m
[23m
[3m
[38;5;246m<dbl>
[39m
[23m

[38;5;250m1
[39m runif   100            1 summary  0.260
[31mNA
[39m

[38;5;250m2
[39m runif   100            1 g
[31mNA
[39m      0.123
Number of data generating functions: 1
Number of analyzing procedures: 2
Number of replications: 1
Estimated replications per hour: 2541574
Start of the simulation: 2026-02-01 14:30:16.86277
End of the simulation: 2026-02-01 14:30:16.864186
--------------------------------------------------

[38;5;246m# A tibble: 2 × 7
[39m
  fun       n replications proc        sd   mean   q0.1

[3m
[38;5;246m<chr>
[39m
[23m
[3m
[38;5;246m<dbl>
[39m
[23m
[3m
[38;5;246m<int>
[39m
[23m
[3m
[38;5;246m<chr>
[39m
[23m
[3m
[38;5;246m<dbl>
[39m
[23m
[3m
[38;5;246m<dbl>
[39m
[23m
[3m
[38;5;246m<dbl>
[39m
[23m

[38;5;250m1
[39m runif   100            1 summary  0.282  0.512
[31mNA
[39m

[38;5;250m2
[39m runif   100            1 g
[31mNA
[39m
[31mNA
[39m      0.147
Number of data generating functions: 1
Number of analyzing procedures: 2
Number of replications: 1
Estimated replications per hour: 3067132
Start of the simulation: 2026-02-01 14:30:16.890403
End of the simulation: 2026-02-01 14:30:16.891577
.truth-functionality
Sometimes it is handy to access the parameter constellation that was used during the data generation in the (post) data analyzing phase. Of course, one could write wrapper functions for every data generating function and append the parameter constellation from the data generation as attributes to the data set, but the purpose of this package is to reduce such administrative source code. Hence if the (post) data analyzing function has an argument .truth, then eval_tibbles will manage that hand-over. A brief example should explain this. Suppose we want to estimate the bias of the empirical quantile estimator if the data is normal distributed.
dg <- expand_tibble(fun = c("rnorm"), mean = c(1,1000), sd = c(1,10), n = c(10L, 100L))
pg <- expand_tibble(proc = "quantile", probs = 0.975)
post_ana <- function(q_est, .truth){
  tibble::tibble(bias = q_est - stats::qnorm(0.975, mean = .truth$mean, sd = .truth$sd))
}
eval_tibbles(dg, pg, replications = 10^3, discard_generated_data = TRUE,
                   ncpus = 2,
                   post_analyze = post_ana,
                   summary_fun = list(mean = mean))
[38;5;246m# A tibble: 8 × 9
[39m
  fun    mean    sd     n replications summary_fun proc     probs    bias

[3m
[38;5;246m<chr>
[39m
[23m
[3m
[38;5;246m<dbl>
[39m
[23m
[3m
[38;5;246m<dbl>
[39m
[23m
[3m
[38;5;246m<int>
[39m
[23m
[3m
[38;5;246m<int>
[39m
[23m
[3m
[38;5;246m<chr>
[39m
[23m
[3m
[38;5;246m<chr>
[39m
[23m
[3m
[38;5;246m<dbl>
[39m
[23m
[3m
[38;5;246m<dbl>
[39m
[23m

[38;5;250m1
[39m rnorm     1     1    10            1 mean        quantile 0.975 -
[31m0
[39m
[31m.
[39m
[31m573
[39m

[38;5;250m2
[39m rnorm
[4m1
[24m000     1    10            1 mean        quantile 0.975 -
[31m0
[39m
[31m.
[39m
[31m550
[39m

[38;5;250m3
[39m rnorm     1    10    10            1 mean        quantile 0.975 -
[31m5
[39m
[31m.
[39m
[31m58
[39m

[38;5;250m4
[39m rnorm
[4m1
[24m000    10    10            1 mean        quantile 0.975 -
[31m5
[39m
[31m.
[39m
[31m34
[39m

[38;5;250m5
[39m rnorm     1     1   100            1 mean        quantile 0.975 -
[31m0
[39m
[31m.
[39m
[31m0
[39m
[31m76
[4m0
[24m
[39m

[38;5;250m6
[39m rnorm
[4m1
[24m000     1   100            1 mean        quantile 0.975 -
[31m0
[39m
[31m.
[39m
[31m0
[39m
[31m87
[4m9
[24m
[39m

[38;5;250m7
[39m rnorm     1    10   100            1 mean        quantile 0.975 -
[31m0
[39m
[31m.
[39m
[31m685
[39m

[38;5;250m8
[39m rnorm
[4m1
[24m000    10   100            1 mean        quantile 0.975 -
[31m0
[39m
[31m.
[39m
[31m695
[39m
Number of data generating functions: 8
Number of analyzing procedures: 1
Number of replications: 1000
Estimated replications per hour: 1189372
Start of the simulation: 2026-02-01 14:30:17.228915
End of the simulation: 2026-02-01 14:30:20.255721
If we want to do the analysis for different distrubtions we could modify our post data analyzing function, but we can also simply add a .truth-column to the data generating grid. In this case, the information from the .truth-column is directly passed to the .truth-parameter:
dg <- dplyr::bind_rows(
  expand_tibble(fun = c("rnorm"), mean = 0, n = c(10L, 100L), .truth = qnorm(0.975)),
  expand_tibble(fun = c("rexp"), rate = 1, n = c(10L, 100L), .truth = qexp(0.975, rate = 1)),
  expand_tibble(fun = c("runif"), max = 2, n = c(10L, 100L), .truth = qunif(0.975, max = 2))
)
pg <- expand_tibble(proc = "quantile", probs = 0.975)
post_ana <- function(q_est, .truth){
  ret <- q_est - .truth
  names(ret) <- "bias"
  ret
}
eval_tibbles(dg, pg, replications = 10^3, discard_generated_data = TRUE,
                   ncpus = 2,
                   post_analyze = post_ana,
                   summary_fun = list(mean = mean))
[38;5;246m# A tibble: 6 × 11
[39m
  fun    mean     n .truth  rate   max replications summary_fun proc     probs    bias

[3m
[38;5;246m<chr>
[39m
[23m
[3m
[38;5;246m<dbl>
[39m
[23m
[3m
[38;5;246m<int>
[39m
[23m
[3m
[38;5;246m<dbl>
[39m
[23m
[3m
[38;5;246m<dbl>
[39m
[23m
[3m
[38;5;246m<dbl>
[39m
[23m
[3m
[38;5;246m<int>
[39m
[23m
[3m
[38;5;246m<chr>
[39m
[23m
[3m
[38;5;246m<chr>
[39m
[23m
[3m
[38;5;246m<dbl>
[39m
[23m
[3m
[38;5;246m<dbl>
[39m
[23m

[38;5;250m1
[39m rnorm     0    10   1.96
[31mNA
[39m
[31mNA
[39m            1 mean        quantile 0.975 -
[31m0
[39m
[31m.
[39m
[31m573
[39m

[38;5;250m2
[39m rnorm     0   100   1.96
[31mNA
[39m
[31mNA
[39m            1 mean        quantile 0.975 -
[31m0
[39m
[31m.
[39m
[31m0
[39m
[31m81
[4m8
[24m
[39m

[38;5;250m3
[39m rexp
[31mNA
[39m    10   3.69     1
[31mNA
[39m            1 mean        quantile 0.975 -
[31m0
[39m
[31m.
[39m
[31m917
[39m

[38;5;250m4
[39m rexp
[31mNA
[39m   100   3.69     1
[31mNA
[39m            1 mean        quantile 0.975 -
[31m0
[39m
[31m.
[39m
[31m175
[39m

[38;5;250m5
[39m runif
[31mNA
[39m    10   1.95
[31mNA
[39m     2            1 mean        quantile 0.975 -
[31m0
[39m
[31m.
[39m
[31m174
[39m

[38;5;250m6
[39m runif
[31mNA
[39m   100   1.95
[31mNA
[39m     2            1 mean        quantile 0.975 -
[31m0
[39m
[31m.
[39m
[31m0
[39m
[31m18
[4m3
[24m
[39m
Number of data generating functions: 6
Number of analyzing procedures: 1
Number of replications: 1000
Estimated replications per hour: 2841267
Start of the simulation: 2026-02-01 14:30:20.622362
End of the simulation: 2026-02-01 14:30:21.889402
In the same fashion one could write a data analyzing function with a parameter .truth. To go even a step further, we store the analytic quantile function in the .truth column:
dg <- dplyr::bind_rows(
  expand_tibble(fun = c("rnorm"), mean = 0, n = c(10L, 1000L),
                .truth = list(function(prob) qnorm(prob, mean = 0))),
  expand_tibble(fun = c("rexp"), rate = 1, n = c(10L, 1000L),
                .truth = list(function(prob) qexp(prob, rate = 1))),
  expand_tibble(fun = c("runif"), max = 2, n = c(10L, 1000L),
                .truth = list(function(prob) qunif(prob, max = 2)))
)
bias_quantile <- function(x, prob, .truth) {
  est <- quantile(x, probs = prob)
  ret <- est - .truth[[1]](prob)
  names(ret) <- "bias"
  ret
}
pg <- expand_tibble(proc = "bias_quantile", prob = c(0.9, 0.975))
eval_tibbles(dg, pg, replications = 10^3, discard_generated_data = TRUE,
                   ncpus = 1,
                   summary_fun = list(mean = mean))
[38;5;246m# A tibble: 12 × 11
[39m
   fun    mean     n .truth  rate   max replications summary_fun proc           prob      bias

[3m
[38;5;246m<chr>
[39m
[23m
[3m
[38;5;246m<dbl>
[39m
[23m
[3m
[38;5;246m<int>
[39m
[23m
[3m
[38;5;246m<list>
[39m
[23m
[3m
[38;5;246m<dbl>
[39m
[23m
[3m
[38;5;246m<dbl>
[39m
[23m
[3m
[38;5;246m<int>
[39m
[23m
[3m
[38;5;246m<chr>
[39m
[23m
[3m
[38;5;246m<chr>
[39m
[23m
[3m
[38;5;246m<dbl>
[39m
[23m
[3m
[38;5;246m<dbl>
[39m
[23m

[38;5;250m 1
[39m rnorm     0    10
[38;5;246m<fn>
[39m
[31mNA
[39m
[31mNA
[39m            1 mean        bias_quantile 0.9   -
[31m0
[39m
[31m.
[39m
[31m218
[39m

[38;5;250m 2
[39m rnorm     0    10
[38;5;246m<fn>
[39m
[31mNA
[39m
[31mNA
[39m            1 mean        bias_quantile 0.975 -
[31m0
[39m
[31m.
[39m
[31m530
[39m

[38;5;250m 3
[39m rnorm     0
[4m1
[24m000
[38;5;246m<fn>
[39m
[31mNA
[39m
[31mNA
[39m            1 mean        bias_quantile 0.9   -
[31m0
[39m
[31m.
[39m
[31m00
[39m
[31m6
[4m2
[24m
[4m6
[24m
[39m

[38;5;250m 4
[39m rnorm     0
[4m1
[24m000
[38;5;246m<fn>
[39m
[31mNA
[39m
[31mNA
[39m            1 mean        bias_quantile 0.975 -
[31m0
[39m
[31m.
[39m
[31m0
[39m
[31m10
[4m6
[24m
[39m

[38;5;250m 5
[39m rexp
[31mNA
[39m    10
[38;5;246m<fn>
[39m       1
[31mNA
[39m            1 mean        bias_quantile 0.9   -
[31m0
[39m
[31m.
[39m
[31m275
[39m

[38;5;250m 6
[39m rexp
[31mNA
[39m    10
[38;5;246m<fn>
[39m       1
[31mNA
[39m            1 mean        bias_quantile 0.975 -
[31m0
[39m
[31m.
[39m
[31m983
[39m

[38;5;250m 7
[39m rexp
[31mNA
[39m
[4m1
[24m000
[38;5;246m<fn>
[39m       1
[31mNA
[39m            1 mean        bias_quantile 0.9   -
[31m0
[39m
[31m.
[39m
[31m00
[39m
[31m2
[4m2
[24m
[4m6
[24m
[39m

[38;5;250m 8
[39m rexp
[31mNA
[39m
[4m1
[24m000
[38;5;246m<fn>
[39m       1
[31mNA
[39m            1 mean        bias_quantile 0.975 -
[31m0
[39m
[31m.
[39m
[31m0
[39m
[31m21
[4m7
[24m
[39m

[38;5;250m 9
[39m runif
[31mNA
[39m    10
[38;5;246m<fn>
[39m
[31mNA
[39m     2            1 mean        bias_quantile 0.9   -
[31m0
[39m
[31m.
[39m
[31m150
[39m

[38;5;250m10
[39m runif
[31mNA
[39m    10
[38;5;246m<fn>
[39m
[31mNA
[39m     2            1 mean        bias_quantile 0.975 -
[31m0
[39m
[31m.
[39m
[31m173
[39m

[38;5;250m11
[39m runif
[31mNA
[39m
[4m1
[24m000
[38;5;246m<fn>
[39m
[31mNA
[39m     2            1 mean        bias_quantile 0.9   -
[31m0
[39m
[31m.
[39m
[31m000
[39m
[31m
[4m5
[24m
[4m2
[24m
[4m4
[24m
[39m

[38;5;250m12
[39m runif
[31mNA
[39m
[4m1
[24m000
[38;5;246m<fn>
[39m
[31mNA
[39m     2            1 mean        bias_quantile 0.975 -
[31m0
[39m
[31m.
[39m
[31m00
[39m
[31m2
[4m0
[24m
[4m1
[24m
[39m
Number of data generating functions: 6
Number of analyzing procedures: 2
Number of replications: 1000
Estimated replications per hour: 1988195
Start of the simulation: 2026-02-01 14:30:22.014817
End of the simulation: 2026-02-01 14:30:23.825505
But one should keep in mind that if one calculates the quantile during the (post) analyzing phase that this is happens on replication level. To be more precise lets look at an excerpt of the pseudo code from the beginning of the vignette:
6.  for g in  {g_1, ..., g_k}
7.      for r in 1:replications (optionally in a parallel manner)
8.          data = g()
9.          for f in  {f_1, \ldots, f_L}
10.             append f(data) to the result object (optionally apply a post-analyze-function)
No matter if one extend the data analyzing function f_1, … f_L or the post-analyze-function with an argument .truth the calculation are made for every single replication during step 10. Hence, the operations are not vectorized!
Some Examples
Note, the following code examples will use more computational resources. In order to prevent that these are checked/executed on the CRAN check farm, they are only evaluated if the environment variable NOT_CRAN is set to “true”
EVAL <- FALSE
if (Sys.getenv("NOT_CRAN") == "true") {
  EVAL <- TRUE
}
Sampling distribution of mean and median for normal and exponential distributed data
First we define how the data is generated, where the sample size should be 10 and 100:
dg <- dplyr::bind_rows(
  expand_tibble(fun = c("rnorm"), mean = 1, n = c(10L, 100L)),
  expand_tibble(fun = c("rexp"), rate = 1, n = c(10L, 100L))
)
dg
[38;5;246m# A tibble: 4 × 4
[39m
  fun    mean     n  rate

[3m
[38;5;246m<chr>
[39m
[23m
[3m
[38;5;246m<dbl>
[39m
[23m
[3m
[38;5;246m<int>
[39m
[23m
[3m
[38;5;246m<dbl>
[39m
[23m

[38;5;250m1
[39m rnorm     1    10
[31mNA
[39m

[38;5;250m2
[39m rnorm     1   100
[31mNA
[39m

[38;5;250m3
[39m rexp
[31mNA
[39m    10     1

[38;5;250m4
[39m rexp
[31mNA
[39m   100     1
Afterwards we define how we want to analyze the data:
pg <- expand_tibble(proc = c("mean", "median"))
pg
[38;5;246m# A tibble: 2 × 1
[39m
  proc

[3m
[38;5;246m<chr>
[39m
[23m

[38;5;250m1
[39m mean

[38;5;250m2
[39m median
Finally, we conduct the simulation and visualize the results
et <- eval_tibbles(dg, pg, replications = 10^4, ncpus = 2)

et$simulation %>%
  ggplot(aes(x = results, color = interaction(fun, n), fill = interaction(fun, n))) +
  geom_density(alpha = 0.3) +
  facet_wrap(~ proc)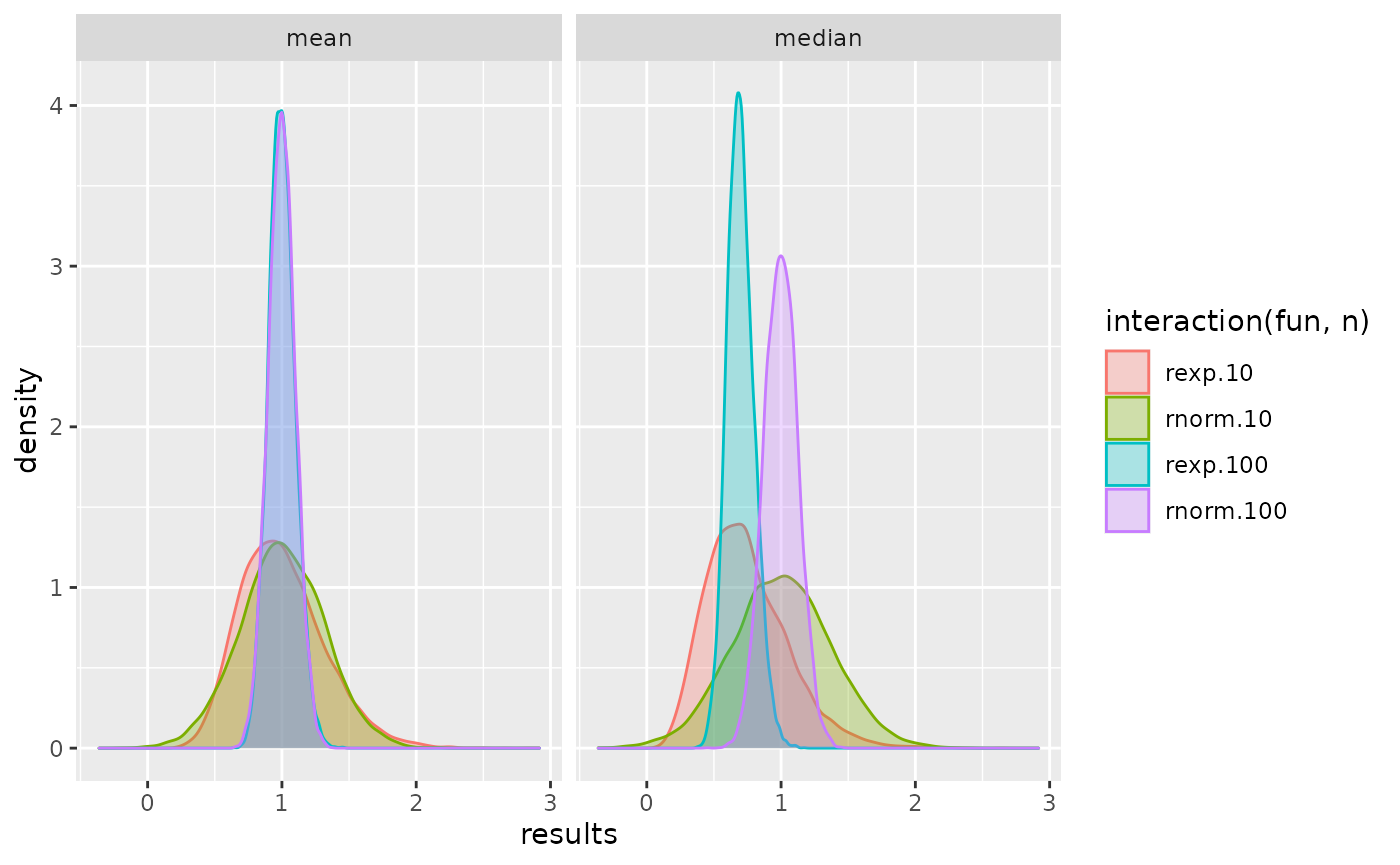
Comparing bootstrap confidence intervals with classical studentized interval
We want to compare the confidence intervals that are generated by boot::boot.ci() and stats::t.test(). Unfortunately, boot::boot.ci() cannot be applied directly to the generated data sets. Therefore, we write a new function:
bootstrap_ci <- function(x, conf.level, R = 999) {
  b <- boot::boot(x, function(d, i) {
    n <- length(i)
    c(
      mean = mean(d[i]),
      variance = (n - 1) * var(d[i]) / n^2
    )
  }, R = R)
  boot::boot.ci(b, conf = conf.level, type = "all")
}
Furthermore, boot::boot.ci() returns in general more than one confidence interval and the structures returned by boot::boot.ci() and stats::t.test() are also very different. One solution could be to write a function t_test() that calls stats::t.test(), modifies the returned object and additionally modify the function bootstrap_ci so that both function return objects with a unified structure. But instead of that we will implement a function that is later on passed to the argument post_analyze of eval_tibbles:
post_analyze <- function(o, .truth) {
  if (class(o) == "htest") {
  #post-process the object returned by t.test
    ci <- o$conf.int
    return(tibble::tibble(
      type = "t.test",
      aspect = c("covered", "ci_length"),
      value = c(ci[1] <= .truth && .truth <= ci[2], ci[2] - ci[1])
    ))
  } else if (class(o) == "bootci") {
  #post-process the object returned by boot.ci
    method = c("normal", "basic", "student", "percent", "bca")
    ret = o[method]
    lower = unlist(purrr::map(ret, ~dplyr::nth(.x[1,], -2)))
    upper = unlist(purrr::map(ret, ~dplyr::nth(.x[1,], -1)))
    type = paste("boot", method, sep = "_")

    return(
      dplyr::bind_rows(
      tibble::tibble(
        type = type,
        aspect = "covered",
        value = as.integer(lower <= .truth & .truth <= upper)),
      tibble::tibble(
        type = type,
        aspect = "ci_length",
        value = upper - lower))
    )
  }
}
As you can see, the objects returned are tibbles with more than one row. Summarizing the data over all replications will in general use the variable type and aspect as grouping variables. This can be achieved by using the parameter group_for_summary of eval_tibbles.
Define and run the simulation
We want to generate normal-, uniform-, and exponential distributed data:
dg <- dplyr::bind_rows(
  simTool::expand_tibble(fun = "rnorm", n = 10L, mean = 0, sd = sqrt(3), .truth = 0),
  simTool::expand_tibble(fun = "runif", n = 10L, max = 6, .truth = 3),
  simTool::expand_tibble(fun = "rexp", n = 10L, rate = 1 / sqrt(3), .truth = sqrt(3))
)
dg
[38;5;246m# A tibble: 3 × 7
[39m
  fun       n  mean    sd .truth   max   rate

[3m
[38;5;246m<chr>
[39m
[23m
[3m
[38;5;246m<int>
[39m
[23m
[3m
[38;5;246m<dbl>
[39m
[23m
[3m
[38;5;246m<dbl>
[39m
[23m
[3m
[38;5;246m<dbl>
[39m
[23m
[3m
[38;5;246m<dbl>
[39m
[23m
[3m
[38;5;246m<dbl>
[39m
[23m

[38;5;250m1
[39m rnorm    10     0  1.73   0
[31mNA
[39m
[31mNA
[39m

[38;5;250m2
[39m runif    10
[31mNA
[39m
[31mNA
[39m      3        6
[31mNA
[39m

[38;5;250m3
[39m rexp     10
[31mNA
[39m
[31mNA
[39m      1.73
[31mNA
[39m  0.577
and apply our functions that calculate the confidence intervals to it using two different confidence levels.
pg <- simTool::expand_tibble(
  proc = c("t.test","bootstrap_ci"),
  conf.level = c(0.9, 0.95)
)
pg
[38;5;246m# A tibble: 4 × 2
[39m
  proc         conf.level

[3m
[38;5;246m<chr>
[39m
[23m
[3m
[38;5;246m<dbl>
[39m
[23m

[38;5;250m1
[39m t.test             0.9

[38;5;250m2
[39m bootstrap_ci       0.9

[38;5;250m3
[39m t.test             0.95

[38;5;250m4
[39m bootstrap_ci       0.95
Note, that the structure of the objects returned are quite different which addressed by our function post_analyze. The variables type and aspect that are created by post_analyze are to distinguish the different confidence intervals. Since these variables are part of the result objects, eval_tibbles assumes that these variables are results. In order to summarize the results (calculating the mean) over all replications correctly we need to tell eval_tibbles that additional group variables are type and aspect:
et <- eval_tibbles(dg, pg,
  replications = 10^3, ncpus = 2,
  cluster_global_objects = "post_analyze",
  post_analyze = post_analyze,
  summary_fun = list(mean = mean),
  group_for_summary = c("aspect", "type")
)
et
[38;5;246m# A tibble: 72 × 14
[39m
   fun       n  mean    sd .truth   max  rate replications summary_fun proc  conf.level aspect type

[3m
[38;5;246m<chr>
[39m
[23m
[3m
[38;5;246m<int>
[39m
[23m
[3m
[38;5;246m<dbl>
[39m
[23m
[3m
[38;5;246m<dbl>
[39m
[23m
[3m
[38;5;246m<dbl>
[39m
[23m
[3m
[38;5;246m<dbl>
[39m
[23m
[3m
[38;5;246m<dbl>
[39m
[23m
[3m
[38;5;246m<int>
[39m
[23m
[3m
[38;5;246m<chr>
[39m
[23m
[3m
[38;5;246m<chr>
[39m
[23m
[3m
[38;5;246m<dbl>
[39m
[23m
[3m
[38;5;246m<chr>
[39m
[23m
[3m
[38;5;246m<chr>
[39m
[23m

[38;5;250m 1
[39m rnorm    10     0  1.73      0
[31mNA
[39m
[31mNA
[39m            1 mean        t.te…        0.9 ci_le… t.te…

[38;5;250m 2
[39m rnorm    10     0  1.73      0
[31mNA
[39m
[31mNA
[39m            1 mean        t.te…        0.9 cover… t.te…

[38;5;250m 3
[39m rnorm    10     0  1.73      0
[31mNA
[39m
[31mNA
[39m            1 mean        boot…        0.9 ci_le… boot…

[38;5;250m 4
[39m rnorm    10     0  1.73      0
[31mNA
[39m
[31mNA
[39m            1 mean        boot…        0.9 ci_le… boot…

[38;5;250m 5
[39m rnorm    10     0  1.73      0
[31mNA
[39m
[31mNA
[39m            1 mean        boot…        0.9 ci_le… boot…

[38;5;250m 6
[39m rnorm    10     0  1.73      0
[31mNA
[39m
[31mNA
[39m            1 mean        boot…        0.9 ci_le… boot…

[38;5;250m 7
[39m rnorm    10     0  1.73      0
[31mNA
[39m
[31mNA
[39m            1 mean        boot…        0.9 ci_le… boot…

[38;5;250m 8
[39m rnorm    10     0  1.73      0
[31mNA
[39m
[31mNA
[39m            1 mean        boot…        0.9 cover… boot…

[38;5;250m 9
[39m rnorm    10     0  1.73      0
[31mNA
[39m
[31mNA
[39m            1 mean        boot…        0.9 cover… boot…

[38;5;250m10
[39m rnorm    10     0  1.73      0
[31mNA
[39m
[31mNA
[39m            1 mean        boot…        0.9 cover… boot…

[38;5;246m# ℹ 62 more rows
[39m

[38;5;246m# ℹ 1 more variable: value <dbl>
[39m
Number of data generating functions: 3
Number of analyzing procedures: 4
Number of replications: 1000
Estimated replications per hour: 14700
Start of the simulation: 2026-02-01 14:30:27.687527
End of the simulation: 2026-02-01 14:34:32.582255
Finally, we can visualize the summarized results:
et$simulation %>%
  ggplot(aes(x = fun, y = value, group = type, fill = type, label = round(value, 2))) +
  geom_col(position = "dodge") +
  geom_label(position = position_dodge(0.9), size = 3) +
  theme(legend.position = "bottom") +
  facet_grid(aspect ~ conf.level, scales = "free")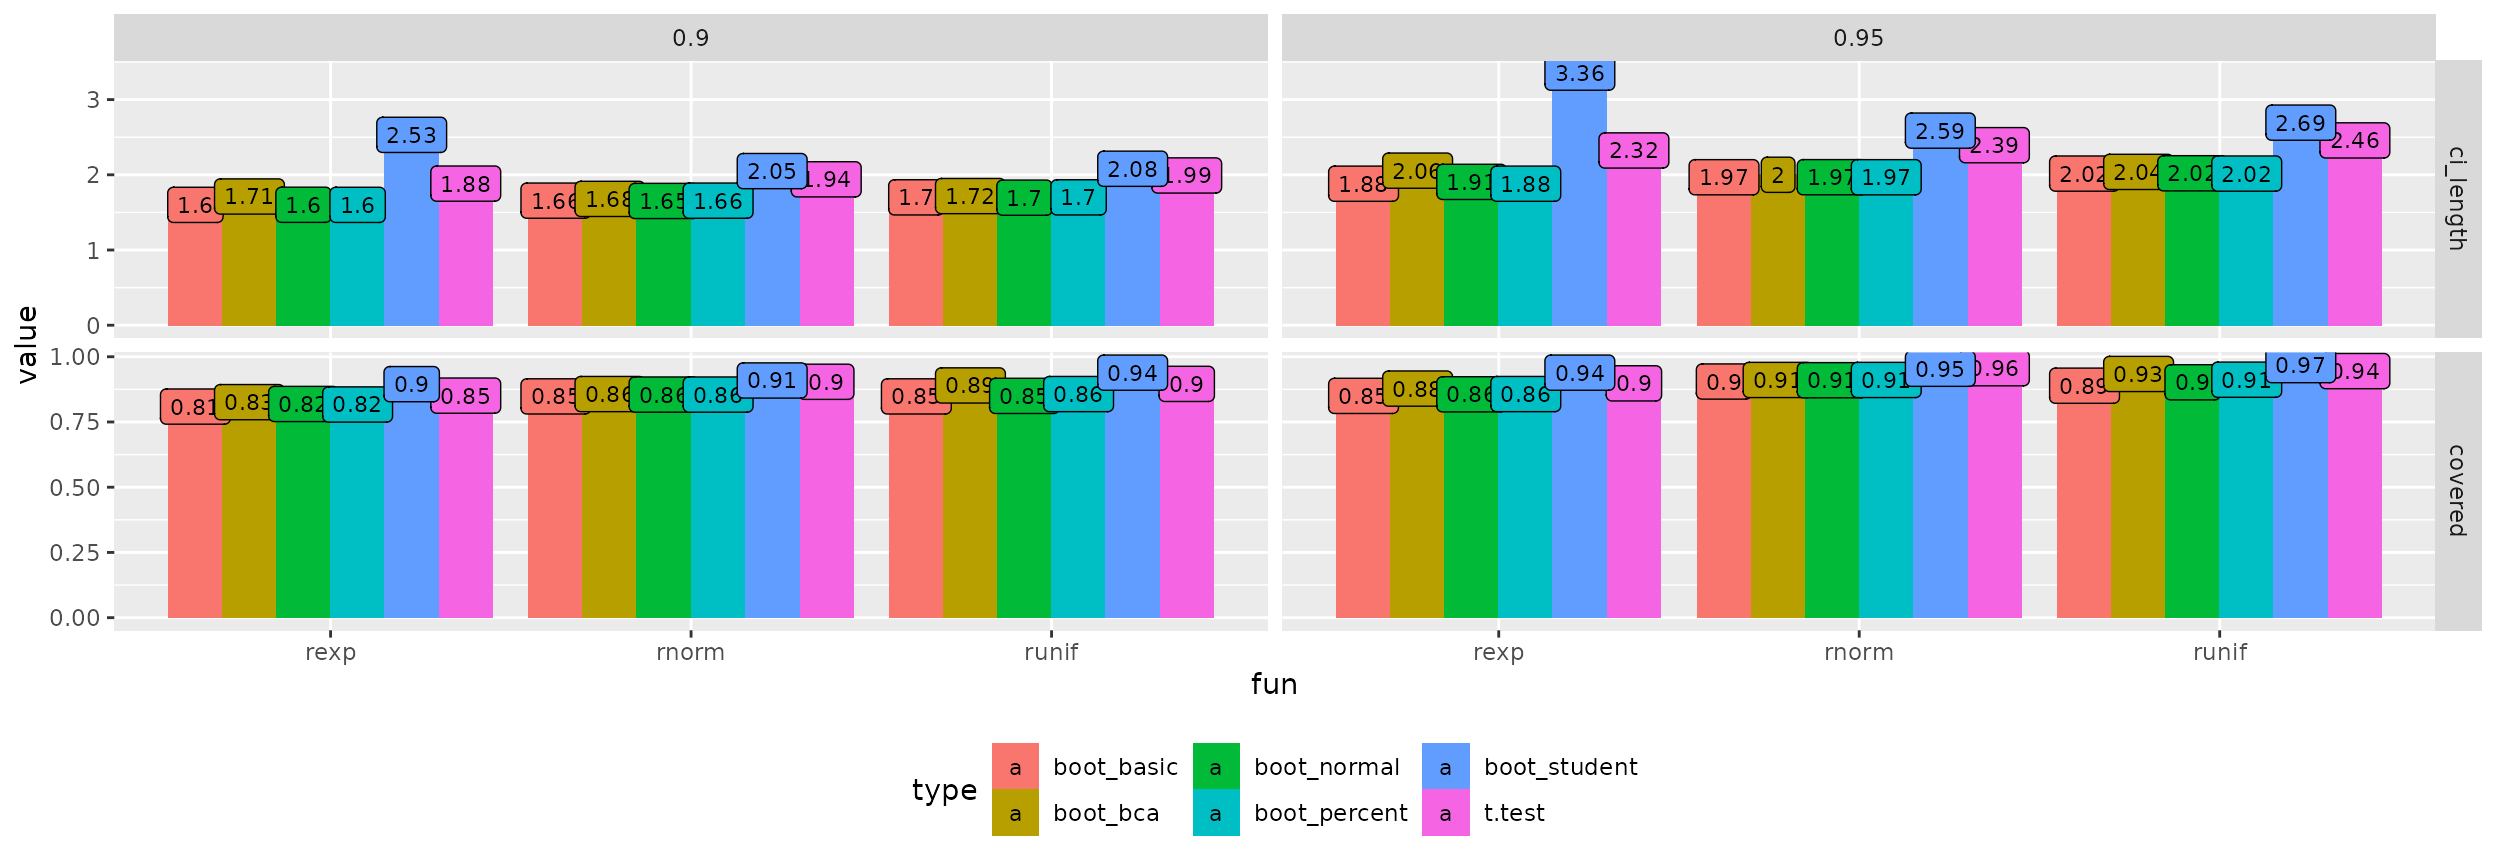
A different implementation
Here we briefly realize the simulation differently by leveraging data analyzing functions with unified return-objects:
t_test = function(x, conf.level){
  tt <- t.test(x, conf.level = conf.level)

  # unify return
  tibble::tibble(type = "t.test", lower = tt$conf.int[1], upper = tt$conf.int[2])
}

bootstrap_ci <- function(x, conf.level, R = 999) {
  b <- boot::boot(x, function(d, i) {
    n <- length(i)
    c(
      mean = mean(d[i]),
      variance = (n - 1) * var(d[i]) / n^2
    )
  }, R = R)
  ci <- boot::boot.ci(b, conf = conf.level, type = "all")
  method = c("normal", "basic", "student", "percent", "bca")
  ret = ci[method]
  lower = unlist(purrr::map(ret, ~dplyr::nth(.x[1,], -2)))
  upper = unlist(purrr::map(ret, ~dplyr::nth(.x[1,], -1)))
  type = paste("boot", method, sep = "_")

  # unify return
  tibble::tibble(type = type, lower = lower, upper = upper)
}

dg <- dplyr::bind_rows(
  simTool::expand_tibble(fun = "rnorm", n = 10L, mean = 0, sd = sqrt(3), .truth = 0),
  simTool::expand_tibble(fun = "runif", n = 10L, max = 6, .truth = 3),
  simTool::expand_tibble(fun = "rexp", n = 10L, rate = 1 / sqrt(3), .truth = sqrt(3))
)

pg <- simTool::expand_tibble(
  proc = c("t_test","bootstrap_ci"),
  conf.level = c(0.9, 0.95)
) %>%
  mutate(R = ifelse(proc == "bootstrap_ci", 100, NA))

et <- eval_tibbles(dg, pg,
  replications = 10^2, ncpus = 2
)
et
[38;5;246m# A tibble: 3,600 × 14
[39m
   fun       n  mean    sd .truth   max  rate replications proc  conf.level     R type  lower  upper

[3m
[38;5;246m<chr>
[39m
[23m
[3m
[38;5;246m<int>
[39m
[23m
[3m
[38;5;246m<dbl>
[39m
[23m
[3m
[38;5;246m<dbl>
[39m
[23m
[3m
[38;5;246m<dbl>
[39m
[23m
[3m
[38;5;246m<dbl>
[39m
[23m
[3m
[38;5;246m<dbl>
[39m
[23m
[3m
[38;5;246m<int>
[39m
[23m
[3m
[38;5;246m<chr>
[39m
[23m
[3m
[38;5;246m<dbl>
[39m
[23m
[3m
[38;5;246m<dbl>
[39m
[23m
[3m
[38;5;246m<chr>
[39m
[23m
[3m
[38;5;246m<dbl>
[39m
[23m
[3m
[38;5;246m<dbl>
[39m
[23m

[38;5;250m 1
[39m rnorm    10     0  1.73      0
[31mNA
[39m
[31mNA
[39m            1 t_te…       0.9
[31mNA
[39m t.te… -
[31m1
[39m
[31m.
[39m
[31m56
[39m 0.235

[38;5;250m 2
[39m rnorm    10     0  1.73      0
[31mNA
[39m
[31mNA
[39m            1 boot…       0.9    100 boot… -
[31m1
[39m
[31m.
[39m
[31m54
[39m 0.200

[38;5;250m 3
[39m rnorm    10     0  1.73      0
[31mNA
[39m
[31mNA
[39m            1 boot…       0.9    100 boot… -
[31m1
[39m
[31m.
[39m
[31m64
[39m 0.177

[38;5;250m 4
[39m rnorm    10     0  1.73      0
[31mNA
[39m
[31mNA
[39m            1 boot…       0.9    100 boot… -
[31m1
[39m
[31m.
[39m
[31m64
[39m 0.500

[38;5;250m 5
[39m rnorm    10     0  1.73      0
[31mNA
[39m
[31mNA
[39m            1 boot…       0.9    100 boot… -
[31m1
[39m
[31m.
[39m
[31m51
[39m 0.312

[38;5;250m 6
[39m rnorm    10     0  1.73      0
[31mNA
[39m
[31mNA
[39m            1 boot…       0.9    100 boot… -
[31m1
[39m
[31m.
[39m
[31m54
[39m 0.098
[4m7
[24m

[38;5;250m 7
[39m rnorm    10     0  1.73      0
[31mNA
[39m
[31mNA
[39m            1 t_te…       0.95
[31mNA
[39m t.te… -
[31m1
[39m
[31m.
[39m
[31m77
[39m 0.446

[38;5;250m 8
[39m rnorm    10     0  1.73      0
[31mNA
[39m
[31mNA
[39m            1 boot…       0.95   100 boot… -
[31m1
[39m
[31m.
[39m
[31m57
[39m 0.123

[38;5;250m 9
[39m rnorm    10     0  1.73      0
[31mNA
[39m
[31mNA
[39m            1 boot…       0.95   100 boot… -
[31m1
[39m
[31m.
[39m
[31m73
[39m 0.257

[38;5;250m10
[39m rnorm    10     0  1.73      0
[31mNA
[39m
[31mNA
[39m            1 boot…       0.95   100 boot… -
[31m1
[39m
[31m.
[39m
[31m83
[39m 0.716

[38;5;246m# ℹ 3,590 more rows
[39m
Number of data generating functions: 3
Number of analyzing procedures: 4
Number of replications: 100
Estimated replications per hour: 150803
Start of the simulation: 2026-02-01 14:34:34.207481
End of the simulation: 2026-02-01 14:34:36.594687
grps <- et$simulation %>%
  select(-replications) %>%
  select(fun:type) %>%
  names

et$simulation %>%
  mutate(covered = lower <= .truth & .truth <= upper,
         ci_length = upper - lower) %>%
  group_by(.dots = grps) %>%
  summarise(coverage = mean(covered),
            ci_length = mean(ci_length))
Warning:
[1m
[22mThe `.dots` argument of `group_by()` is deprecated as of dplyr 1.0.0.
[36mℹ
[39m The deprecated feature was likely used in the
[34mdplyr
[39m package.
Please report the issue at
[3m
[34m<https://github.com/tidyverse/dplyr/issues>
[39m
[23m.
[90mThis warning is displayed once per session.
[39m
[90mCall `lifecycle::last_lifecycle_warnings()` to see where this warning was generated.
[39m
[1m
[22m`summarise()` has grouped output by 'fun', 'n', 'mean', 'sd', '.truth', 'max', 'rate', 'proc',
'conf.level', 'R'. You can override using the `.groups` argument.
[38;5;246m# A tibble: 36 × 13
[39m

[38;5;246m# Groups:   fun, n, mean, sd, .truth, max, rate, proc, conf.level, R [12]
[39m
   fun       n  mean    sd .truth   max  rate proc         conf.level     R type  coverage ci_length

[3m
[38;5;246m<chr>
[39m
[23m
[3m
[38;5;246m<int>
[39m
[23m
[3m
[38;5;246m<dbl>
[39m
[23m
[3m
[38;5;246m<dbl>
[39m
[23m
[3m
[38;5;246m<dbl>
[39m
[23m
[3m
[38;5;246m<dbl>
[39m
[23m
[3m
[38;5;246m<dbl>
[39m
[23m
[3m
[38;5;246m<chr>
[39m
[23m
[3m
[38;5;246m<dbl>
[39m
[23m
[3m
[38;5;246m<dbl>
[39m
[23m
[3m
[38;5;246m<chr>
[39m
[23m
[3m
[38;5;246m<dbl>
[39m
[23m
[3m
[38;5;246m<dbl>
[39m
[23m

[38;5;250m 1
[39m rexp     10
[31mNA
[39m
[31mNA
[39m   1.73
[31mNA
[39m 0.577 bootstrap_ci       0.9    100 boot…     0.8       1.61

[38;5;250m 2
[39m rexp     10
[31mNA
[39m
[31mNA
[39m   1.73
[31mNA
[39m 0.577 bootstrap_ci       0.9    100 boot…     0.8       1.76

[38;5;250m 3
[39m rexp     10
[31mNA
[39m
[31mNA
[39m   1.73
[31mNA
[39m 0.577 bootstrap_ci       0.9    100 boot…     0.8       1.60

[38;5;250m 4
[39m rexp     10
[31mNA
[39m
[31mNA
[39m   1.73
[31mNA
[39m 0.577 bootstrap_ci       0.9    100 boot…     0.81      1.61

[38;5;250m 5
[39m rexp     10
[31mNA
[39m
[31mNA
[39m   1.73
[31mNA
[39m 0.577 bootstrap_ci       0.9    100 boot…     0.88      2.42

[38;5;250m 6
[39m rexp     10
[31mNA
[39m
[31mNA
[39m   1.73
[31mNA
[39m 0.577 bootstrap_ci       0.95   100 boot…     0.82      1.93

[38;5;250m 7
[39m rexp     10
[31mNA
[39m
[31mNA
[39m   1.73
[31mNA
[39m 0.577 bootstrap_ci       0.95   100 boot…     0.85      2.03

[38;5;250m 8
[39m rexp     10
[31mNA
[39m
[31mNA
[39m   1.73
[31mNA
[39m 0.577 bootstrap_ci       0.95   100 boot…     0.83      1.89

[38;5;250m 9
[39m rexp     10
[31mNA
[39m
[31mNA
[39m   1.73
[31mNA
[39m 0.577 bootstrap_ci       0.95   100 boot…     0.85      1.93

[38;5;250m10
[39m rexp     10
[31mNA
[39m
[31mNA
[39m   1.73
[31mNA
[39m 0.577 bootstrap_ci       0.95   100 boot…     0.93      3.26

[38;5;246m# ℹ 26 more rows
[39m